Essay
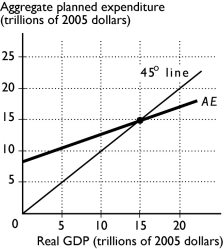
-The above figure shows the AE curve and 45° line for an economy.
a. If real GDP equals $10 trillion, how do firms' inventories compare to their planned inventories?
b. If real GDP equals $20 trillion, how do firms' inventories compare to their planned inventories?
c. What is the equilibrium level of expenditure?
Why is this amount the equilibrium?
Correct Answer:

Verified
a. If real GDP equals $10 trillion, aggr...View Answer
Unlock this answer now
Get Access to more Verified Answers free of charge
Correct Answer:
Verified
View Answer
Unlock this answer now
Get Access to more Verified Answers free of charge
Q175: Discuss the relationship between the business cycle
Q283: On a graph of the consumption function,
Q284: If your MPC is 0.5, then when
Q285: The consumption function shows the relationship between<br>A)
Q286: <span class="ql-formula" data-value="\begin{array} { c c c
Q289: The equilibrium level of aggregate planned expenditure
Q290: When the multiplier is _ , an
Q291: An increase in the price level leads
Q292: If the marginal propensity to consume is
Q293: Induced expenditure includes<br>A) consumption expenditure, government expenditure