Multiple Choice
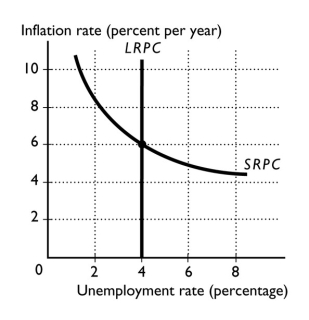
-In the figure above, the expected inflation rate is
A) 0 percent.
B) 2 percent.
C) 4 percent.
D) 6 percent.
E) 8 percent.
Correct Answer:

Verified
Correct Answer:
Verified
Related Questions
Q99: When the natural unemployment rate changes, what
Q198: The short-run Phillips curve is _ and
Q199: The relationship between the AS-AD model and
Q200: <img src="https://d2lvgg3v3hfg70.cloudfront.net/TB1454/.jpg" alt=" -In the above
Q201: The long-run Phillips curve shows the relationship
Q203: At full employment,<br>A) real GDP exceeds potential
Q204: If the price level rises from 100
Q206: The long-run Phillips curve represents the relationship
Q207: The short-run Phillips curve shows<br>A) potential GDP.<br>B)
Q208: In order to keep the real wage