Essay
In the figure below, draw a short-run Phillips curve and a long-run Phillips curve if the expected inflation rate is 4 percent and the natural unemployment rate is 6 percent.
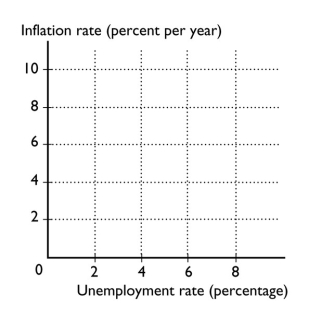
Explain how the two change in the short run if:
a. slower growth in aggregate demand causes a recession.
b. the inflation rate increases.
c. the natural unemployment rate increases.
Correct Answer:

Verified

The figure with the Phillips curves is...View Answer
Unlock this answer now
Get Access to more Verified Answers free of charge
Correct Answer:
Verified
The figure with the Phillips curves is...
View Answer
Unlock this answer now
Get Access to more Verified Answers free of charge
Q142: Suppose the natural unemployment rate is 4
Q143: A "credible announced" inflation reduction policy is
Q144: Along a short-run Phillips curve when the
Q145: <img src="https://d2lvgg3v3hfg70.cloudfront.net/TB1454/.jpg" alt=" The figure
Q148: The short-run Phillips curve presents a tradeoff
Q149: The short-run Phillips curve is another way
Q150: Of the following polices, when would the
Q151: Changes in which of the following do
Q152: The inflation-reduction episode of the early 1980s
Q315: Explain how the short-run and long-run Phillips