Multiple Choice
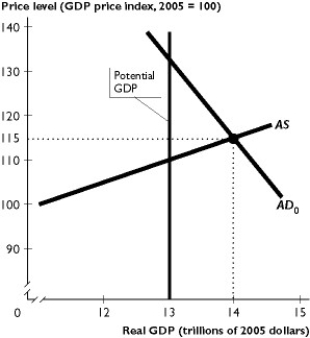
The figure above shows an economy's aggregate demand curve, aggregate supply curve, and potential GDP.
-In the figure above, to use fiscal policy to move the economy back to potential GDP, the government must decrease government expenditure by ________ $1 trillion and/or increase taxes by ________ $1 trillion.
A) recessionary; more than; more than
B) inflationary; less than; more than
C) inflationary; exactly; exactly
D) inflationary; less than; less than
E) recessionary; less than; less than
Correct Answer:

Verified
Correct Answer:
Verified
Q2: Compare the views of Keynesian and mainstream
Q3: <img src="https://d2lvgg3v3hfg70.cloudfront.net/TB1454/.jpg" alt=" The figure
Q6: The government expenditure multiplier reflects the magnification
Q21: If the federal government has a budget
Q31: A fiscal stimulus works to close a
Q37: When government outlays are less than tax
Q76: Assume the federal government raises taxes (a
Q91: Automatic stabilizers decrease the impact of a
Q122: Needs-tested spending is defined as<br>A)spending by Congress
Q208: If government expenditure on goods and services