Multiple Choice
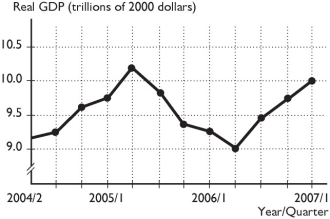
-Based on the figure above, in which quarter or quarters did a trough occur?
A) between 2004, 2nd quarter to 2005, 2nd quarter and also between 2006, 2nd quarter to the end of the figure
B) in 2005, 2nd quarter
C) between 2005, 2nd quarter to 2006, 2nd quarter
D) in 2006, 2nd quarter
E) There are no troughs illustrated in the figure.
Correct Answer:

Verified
Correct Answer:
Verified
Q6: <img src="https://d2lvgg3v3hfg70.cloudfront.net/TB1457/.jpg" alt=" -The table gives
Q35: <img src="https://d2lvgg3v3hfg70.cloudfront.net/TB8586/.jpg" alt=" -The table above
Q68: <img src="https://d2lvgg3v3hfg70.cloudfront.net/TB1457/.jpg" alt=" -The table above
Q74: In measuring GDP,which of the following is
Q87: <img src="https://d2lvgg3v3hfg70.cloudfront.net/TB1455/.jpg" alt=" -Bananaland produces only
Q108: Which of the following is classified as
Q162: Which of the following is a final
Q170: The underground economy<br>A)is measured by government officials
Q203: Which of the following describe the United
Q233: The sum of all the income categories