Multiple Choice
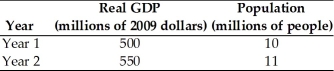
-According to the data in the table above,
A) the standard of living improved between year 1 and year 2.
B) the standard of living worsened between year 1 and year 2.
C) as measured by real GDP per person,the standard of living remained the same between year 1 and year 2.
D) real GDP grew more rapidly than population between year 1 and year 2.
E) real GDP grew more slowly than population between year 1 and year 2.
Correct Answer:

Verified
Correct Answer:
Verified
Q243: The Lucas Wedge shows<br>A)the negative impact a
Q244: A reason a nation faces diminishing returns
Q245: Holding all other influences constant,the quantity of
Q246: With fixed quantities of capital,land,and entrepreneurship and
Q247: Growth in the standard of living is
Q249: Briefly define real and potential GDP,and explain
Q250: An increase in the real wage rate
Q251: One possible way of achieving faster economic
Q252: Why is economic growth so slow or
Q253: Labor force productivity has increased from $30