Multiple Choice
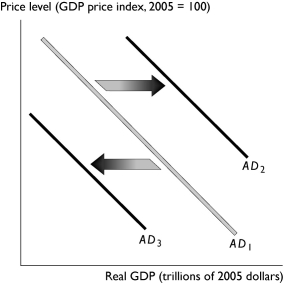
-In the figure above, the shift in the aggregate demand curve from AD₁ to AD₃ could be the result of
A) a fall in the price level.
B) a tax cut.
C) an increased expectation of a recession that lowers people's expected future incomes.
D) a decrease in the foreign exchange rate.
E) a rise in the price level.
Correct Answer:

Verified
Correct Answer:
Verified
Q3: According to the AS-AD model,<br>A)the aggregate quantity
Q95: When potential GDP increases,<br>A)the AS curve shifts
Q103: Demand-pull inflation starts with<br>A)an increase in aggregate
Q138: The aggregate demand curve shifts when any
Q143: If the economy is at macroeconomic equilibrium,then
Q180: Cost-push inflation can be started by<br>A)a decrease
Q233: A rise in the price level<br>A)decreases aggregate
Q255: If the quantity of real GDP demanded
Q257: The aggregate supply curve shifts<br>A)rightward if potential
Q279: When the price level rises and increases