Multiple Choice
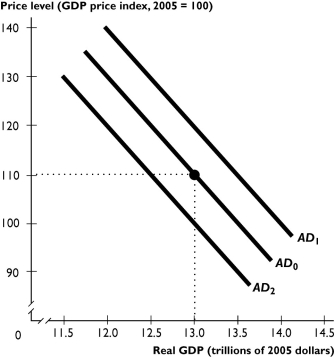
The figure above shows aggregate demand curves.
-Based on the figure above, the aggregate demand curve will shift from AD₀ to AD₁ when
A) potential GDP increases.
B) the price level falls.
C) the price level rises.
D) government expenditure decreases.
E) the Federal Reserve lowers the interest rate.
Correct Answer:

Verified
Correct Answer:
Verified
Q19: <img src="https://d2lvgg3v3hfg70.cloudfront.net/TB1457/.jpg" alt=" -What is the
Q115: An increase in the price level leads
Q120: If people's expectations about future income improve
Q159: A crisis in the Middle East drastically
Q208: Which of the following does NOT shift
Q217: Along the aggregate supply curve,the quantity of
Q231: If investment spending increases by $1 million,then
Q243: The slope of the aggregate supply curve
Q255: In the figure above, the economy is
Q261: Moving along the potential GDP line, when