Multiple Choice
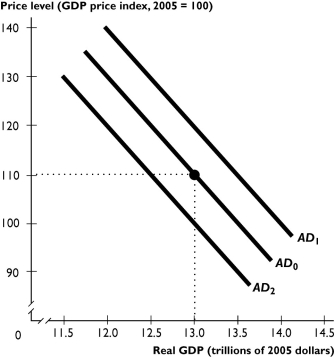
The figure above shows aggregate demand curves.
-Based on the figure above, the aggregate demand curve will shift from AD₀ to AD₂ when
A) potential GDP increases.
B) the price level falls.
C) taxes are lowered.
D) government expenditure increases.
E) the Federal Reserve raises the interest rate.
Correct Answer:

Verified
Correct Answer:
Verified
Q20: If the equilibrium price level is 135
Q52: During the late 1960s,U.S.defense spending increased as
Q65: When OPEC nearly tripled the price of
Q68: "Moving along the AS curve,the real wage
Q69: _ increases the quantity of real GDP
Q73: At a trough in the business cycle,the
Q89: What two variables are determined in an
Q141: Which of the following factors could start
Q161: In a demand-pull inflation,money wage rates rise
Q223: <img src="https://d2lvgg3v3hfg70.cloudfront.net/TB1457/.jpg" alt=" -The table above