Multiple Choice
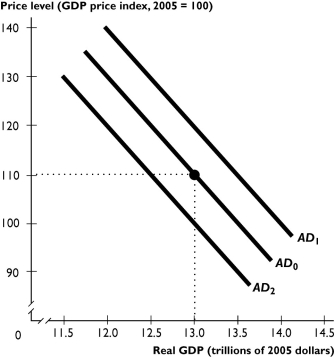
The figure above shows aggregate demand curves.
-Based on the figure above, the aggregate demand curve will shift from AD₀ to AD₂ when
A) potential GDP increases.
B) the price level falls.
C) the price level rises.
D) government expenditure decreases.
E) taxes are lowered.
Correct Answer:

Verified
Correct Answer:
Verified
Q38: Which of the following shifts the aggregate
Q54: The government increases the level of government
Q55: If demand pull inflation occurs when the
Q76: The real wage rate definitely falls if
Q85: The slope of the aggregate supply curve
Q140: The economy is at full employment.If aggregate
Q185: If potential GDP increases,then in the figure
Q271: Does a rise in the price level
Q292: A technological advance _ potential GDP,_ aggregate
Q299: <img src="https://d2lvgg3v3hfg70.cloudfront.net/TB1457/.jpg" alt=" -The change reflected