Multiple Choice
20.3 Chapter Figures
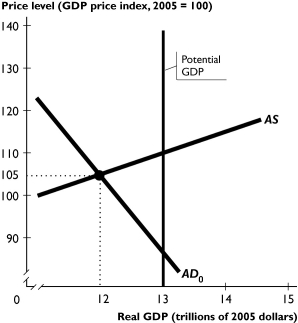
The figure above shows a nation's aggregate demand curve, aggregate supply curve, and potential GDP.
-In the figure above, to use fiscal policy to move the economy back to potential GDP, the government must increase government expenditure by ________ $1 trillion and/or decrease taxes by ________ $1 trillion.
A) recessionary; exactly; exactly
B) inflationary; less than; less than
C) recessionary; less than; more than
D) recessionary; less than; less than
E) recessionary; more than; more than
Correct Answer:

Verified
Correct Answer:
Verified
Q27: If the Fed is concerned about inflation,its
Q64: If tax revenue is $230 billion and
Q73: If the Fed lowers the federal funds
Q77: When tax revenue _ outlays is positive,then
Q96: Depending on the relative size of the
Q139: Needs-tested spending is best described as<br>A)spending on
Q150: The supply-side effects of an income tax
Q175: Automatic changes in tax revenues and expenditures
Q192: Which has a larger effect on aggregate
Q208: If government expenditure on goods and services