Multiple Choice
This graph shows which of the following? 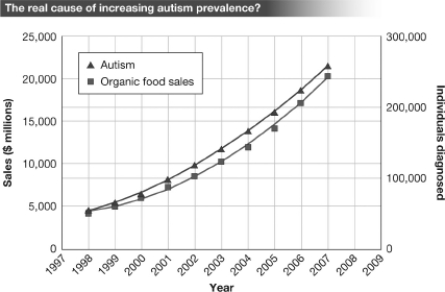
A) There is a positive correlation between the sale/consumption of organic food and the number of individuals diagnosed with autism between 1998 and 2007.
B) The increased consumption of organic food has led to an increase in the rate of autism between 1998 and 2007.
C) Consuming organic food causes autism.
D) There is positive evidence that a cause-and-effect relationship exists between the consumption of organic food and the development of autism.
Correct Answer:

Verified
Correct Answer:
Verified
Q1: An individual claims to be able to
Q7: When determining whether or not a claim
Q9: You search the Internet for information regarding
Q11: Which of the following is LEAST likely
Q17: When Lori was diagnosed with breast cancer,the
Q32: A researcher noticed that as the prevalence
Q46: Evaluate the following and determine whether or
Q55: You are reading an article in Discover
Q62: Which of the following texts are examples
Q70: Which of the following texts are examples