Multiple Choice
At 10 hours,the population shown in this graph has reached the: 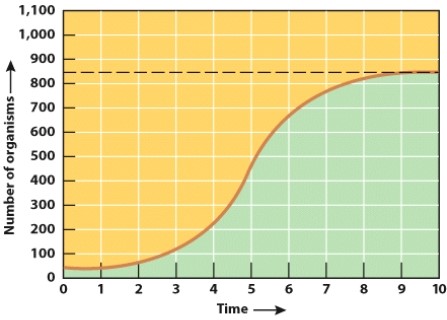
A) carrying capacity for this environment.
B) biotic potential of the organism.
C) J-curve plateau.
D) J-curve dip.
Correct Answer:

Verified
Correct Answer:
Verified
Related Questions
Q2: Eutrophication is the sudden increase in nutrient
Q3: A woman who dies at age 25
Q4: Which organism is not a typical example
Q5: What is a typical characteristic of type
Q6: Which is a chemical responsible for acid
Q8: Great white sharks are considered tertiary or
Q9: The belief in the literal interpretation of
Q10: What should be true about the DNA
Q11: Human cytochrome c protein is virtually identical
Q12: What does the 'p²' represent in this