Essay
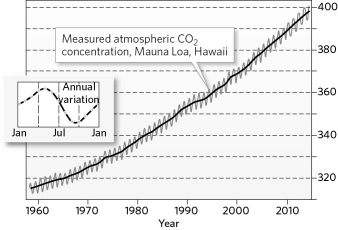
The graph below is the Keeling Curve, a record of carbon dioxide measured at Mauna Loa beginning in 1958. What can be learned from this graph? What do the two lines (black and grey) tell us?
Correct Answer:

Verified
The Keeling Curve shows atmospheric conc...View Answer
Unlock this answer now
Get Access to more Verified Answers free of charge
Correct Answer:
Verified
View Answer
Unlock this answer now
Get Access to more Verified Answers free of charge
Q17: How is weather different from climate? How
Q18: During autumn in the Northern Hemisphere, which
Q19: Charles Keeling learned that the amount of
Q20: What season is illustrated for the Northern
Q21: Why did Charles Keeling choose to install
Q23: The angle of incidence, the angle between
Q24: Warming of the global system could cause
Q25: Global temperatures have _ in the past
Q26: Based on the image below, which region
Q27: The greenhouse effect is<br>A)the current increase in