Multiple Choice
Exhibit 1A-4
a.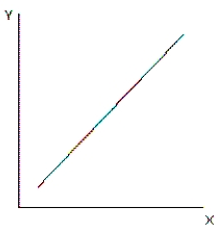
b.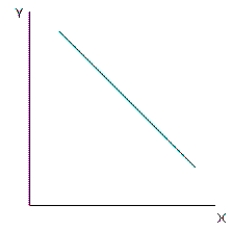
c. 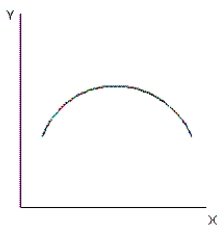 d.
d.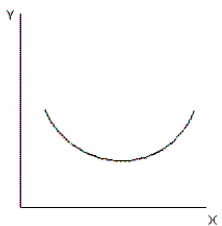
-Refer to the exhibit.Which graph illustrates a relationship between variable X and variable that begins negatively, but changes to a positive relationship?
A) graph a
B) graph b
C) graph c
D) graph d
Correct Answer:

Verified
Correct Answer:
Verified
Q14: The cost of producing copper tubing is
Q15: What does the origin on a graph
Q16: Exhibit 1A-4<br> a.<br><img src="https://d2lvgg3v3hfg70.cloudfront.net/TB4905/.jpg" alt="Exhibit 1A-4
Q17: Exhibit 1A-1<br><img src="https://d2lvgg3v3hfg70.cloudfront.net/TB4905/.jpg" alt="Exhibit 1A-1
Q18: Exhibit 1A-2<br> <img src="https://d2lvgg3v3hfg70.cloudfront.net/TB4905/.jpg" alt="Exhibit 1A-2
Q20: Exhibit 1A-10<br> <img src="https://d2lvgg3v3hfg70.cloudfront.net/TB4905/.jpg" alt="Exhibit 1A-10
Q21: Exhibit 1A-14<br> <img src="https://d2lvgg3v3hfg70.cloudfront.net/TB4905/.jpg" alt="Exhibit 1A-14
Q22: Exhibit 1A-4<br> a.<br><img src="https://d2lvgg3v3hfg70.cloudfront.net/TB4905/.jpg" alt="Exhibit 1A-4
Q23: On a graph with x on the
Q24: Exhibit 1A-1<br><img src="https://d2lvgg3v3hfg70.cloudfront.net/TB4905/.jpg" alt="Exhibit 1A-1