Multiple Choice
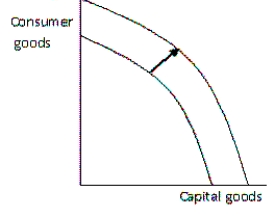
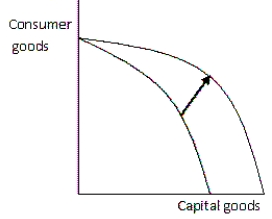
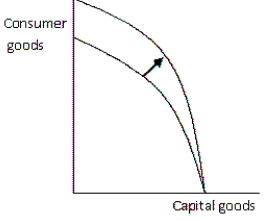
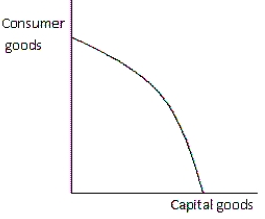
Exhibit 2-7
a.
b.
C.  d.
d.
-Refer to the exhibit.Suppose a country's rate of immigration increases dramatically.Which graph best illustrates the impact on the production possibilities frontier?
A) graph a
B) graph b
C) graph c
D) graph d
Correct Answer:

Verified
Correct Answer:
Verified
Q28: Exhibit 2-7<br> a.<br><img src="https://d2lvgg3v3hfg70.cloudfront.net/TB4905/.jpg" alt="Exhibit 2-7
Q29: Exhibit 2-3<br> <img src="https://d2lvgg3v3hfg70.cloudfront.net/TB4905/.jpg" alt="Exhibit 2-3
Q30: Which of the following would cause the
Q31: Which of the following is a major
Q32: Jason can wash a car in 20
Q34: When does a country have an absolute
Q35: Which statement best reflects the law of
Q36: What term refers to the set of
Q37: One function of money is as a
Q38: Which of the following is an example