Multiple Choice
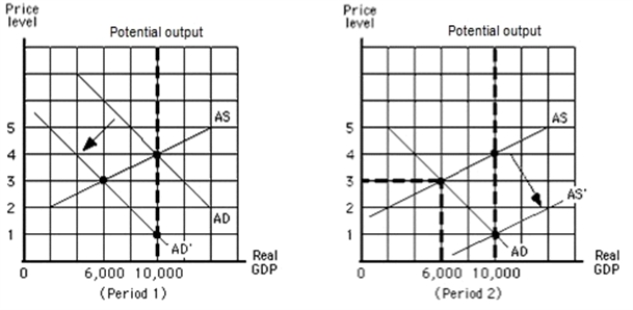
-Refer to the graphs in the exhibit.From the beginning of period 1 to the end of period 2, what happened to real GDP?
A) Real GDP decreased, and then it increased.
B) Real GDP increased, and then it decreased.
C) Real GDP fell from $10,000 to $6,000.
D) Real GDP rose from $6,000 to $10,000.
Correct Answer:

Verified
Correct Answer:
Verified
Q5: What will an increase in aggregate supply
Q6: What happened to unemployment, prices, and output
Q7: What would an increase in government spending
Q8: Which of the following characterizes the nature
Q9: According to Keynes, the policy of incurring
Q11: <img src="https://d2lvgg3v3hfg70.cloudfront.net/TB4905/.jpg" alt=" -Refer
Q12: Which of the following is a stock
Q13: Suppose the Canadian price level increased relative
Q14: According to Keynesian economics, what does fine-tuning
Q15: The global financial panic in September 2008