Multiple Choice
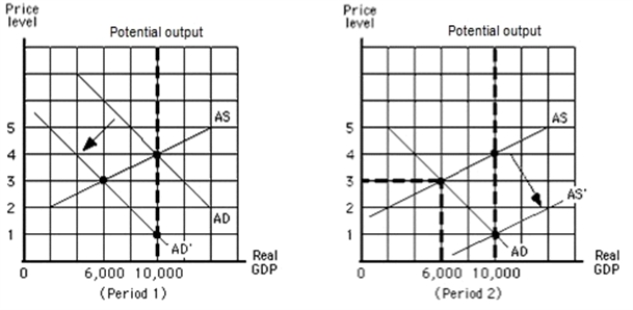
-Refer to the graphs in the exhibit.From the beginning of period 1 to the end of period 2, what happened to real GDP?
A) It increased from $6,000 to $10,000 and stayed there.
B) It decreased from $10,000 to $6,000 and stayed there.
C) It decreased from $10,000 to $,6,000 in period 1, and it increased from $6,000 to $10,000 in period 2.
D) It increased from $6,000 to $10,000 in period 1, and it decreased from $10,000 to $6,000 in period 2.
Correct Answer:

Verified
Correct Answer:
Verified
Q61: Which statement best characterizes why an aggregate
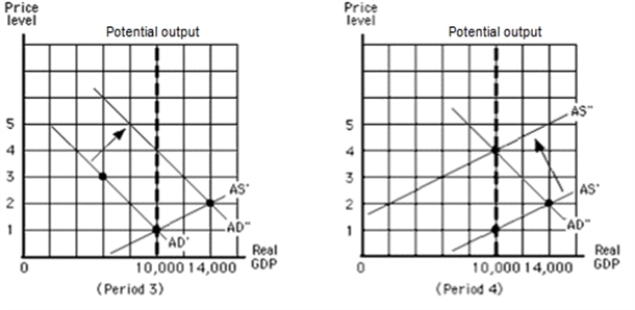
Q62: <img src="https://d2lvgg3v3hfg70.cloudfront.net/TB4905/.jpg" alt=" -Refer
Q63: Which of the following best describes the
Q64: Which of the following could be a
Q65: What is the ultimate objective of macroeconomics?
Q67: If GDP rises, what happens to income
Q68: Which of the following would indicate the
Q69: What is the definition of a depression?
Q70: How did Keynes propose that government should
Q71: According to Keynes, what does the term