Multiple Choice
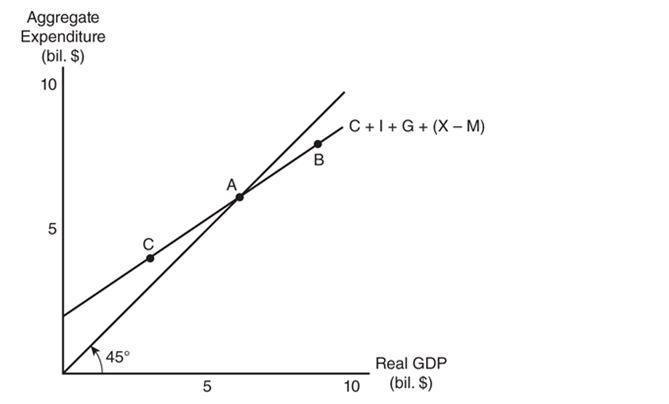
-Refer to the graph in the exhibit.Which of the following best describes the situation at point C?
A) Consumption expenditures exceed disposable income.
B) Real GDP exceeds aggregate expenditure.
C) Aggregate expenditure is exactly equal to real GDP.
D) Aggregate expenditure exceeds real GDP.
Correct Answer:

Verified
Correct Answer:
Verified
Q126: Suppose an increase in planned investment of
Q127: How will an increase in the price
Q128: Suppose planned autonomous investment increases by $200
Q129: <br><br> <span class="ql-formula" data-value="\begin{array}{l}\text { Schedule
Q130: <br><br> <span class="ql-formula" data-value="\begin{array}{l}\text { Schedule
Q132: Suppose the price level increases.How will the
Q133: Suppose the multiplier is 4.What would be
Q134: In the income-expenditure framework, if planned aggregate
Q135: Suppose planned investment increases by $200 billion
Q136: Suppose an economy is in equilibrium when