Multiple Choice
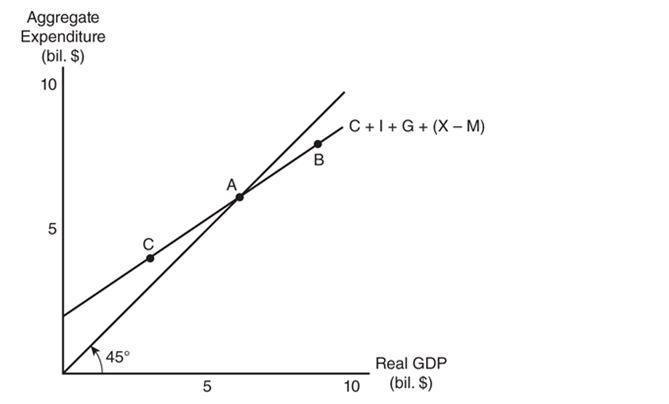
-Refer to the graph in the exhibit.Which of the following best describes the situation at point C?
A) Consumption expenditures exceed disposable income.
B) Producers are experiencing an unexpected loss in inventory.
C) Aggregate expenditure is exactly equal to real GDP.
D) Real GDP exceeds aggregate expenditure.
Correct Answer:

Verified
Correct Answer:
Verified
Q21: Suppose the Canadian price level rises relative
Q22: How will an increase in the price
Q23: Suppose autonomous investment expenditures decline because of
Q24: A grocery store manager must decide whether
Q25: Which of the following will cause the
Q27: <img src="https://d2lvgg3v3hfg70.cloudfront.net/TB4905/.jpg" alt=" -Refer to the
Q28: How will an increase in the price
Q29: Suppose the marginal propensity to consume is
Q30: <img src="https://d2lvgg3v3hfg70.cloudfront.net/TB4905/.jpg" alt=" -Refer to the
Q31: When does the equilibrium quantity of aggregate