Multiple Choice
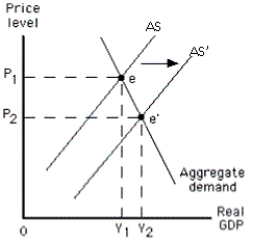
-Refer to the graph in the exhibit.What does the graph illustrate regarding aggregate supply?
A) an increase in short-run aggregate supply
B) an increase in long-run aggregate supply
C) a decrease in short-run aggregate supply
D) a decrease in long-run aggregate supply
Correct Answer:

Verified
Correct Answer:
Verified
Q103: Given the aggregate demand curve, what effects
Q104: Which of the following would shift the
Q105: What is the main effect of a
Q106: Some resource prices are assumed to be
Q107: Other things constant, what relationship is expressed
Q109: Suppose the price level rises by 5
Q110: Suppose the expected price level falls below
Q111: Which of the following best describes how
Q112: <img src="https://d2lvgg3v3hfg70.cloudfront.net/TB4905/.jpg" alt=" -Refer to the
Q113: Suppose nominal wage rates increase by 2