Multiple Choice
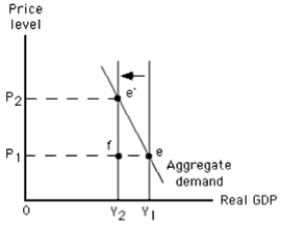
-Refer to the graph in the exhibit.Which of the following could have caused the shift of the curve?
A) a decrease in the size of the labour force
B) a decrease in the price level
C) a positive level of net investment
D) an increase in autonomous consumption
Correct Answer:

Verified
Correct Answer:
Verified
Q25: Which of the following is a crucial
Q26: Which of the following would shift the
Q27: What is the main effect of an
Q28: How would an adverse supply shock shift
Q29: Suppose the economy is initially in long-run
Q31: Which of the following best describes how
Q32: What does the potential output of an
Q33: Which of the following would shift the
Q34: Which of the following will cause potential
Q35: <img src="https://d2lvgg3v3hfg70.cloudfront.net/TB4905/.jpg" alt=" -Refer to the