Multiple Choice
Exhibit 14-5
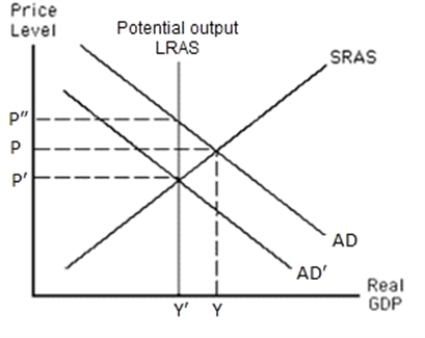
-Refer to the graph in the exhibit.What does the graph illustrate about the state of the economy?
A) The economy is in a long-run equilibrium at the price level P and income level Y.
B) The economy is in a short-run equilibrium at the price level P and income level Y.
C) The economy is experiencing a recessionary gap at price level P and income level Y.
D) The economy is in a short-run equilibrium at the price level P′ and income level Y.
Correct Answer:

Verified
Correct Answer:
Verified
Q1: What is the advantage of money as
Q2: Suppose nominal GDP is $2 trillion and
Q3: Which way does the money demand curve
Q4: In which of the following situations would
Q6: In the history of Canada's monetary policy,
Q7: What effect will an increase in the
Q8: Which of the following, other things constant,
Q9: Suppose the money supply increases when there
Q10: Which of the following has been a
Q11: As the interest rate decreases, what is