Short Answer
BAR GRAPH OF DEMOGRAPHIC DATA FOR CANADA, THE U.S., AND MEXICO
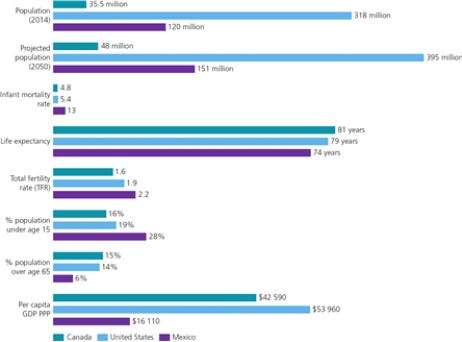
-According to the graph,how much higher is the total fertility rate in Mexico than in Canada?
Correct Answer:

Verified
Correct Answer:
Verified
Related Questions
Q60: What percentage of the world's land is
Q61: Which sector would experience a rise in
Q62: THE DEMOGRAPHIC TRANSITION<br> <img src="https://d2lvgg3v3hfg70.cloudfront.net/TB4979/.jpg" alt="THE DEMOGRAPHIC
Q63: Which of the following would be omitted
Q64: The _ has declined because of food
Q66: What is the correct way to calculate
Q67: What annual rate of change (natural increase)was
Q68: BAR GRAPH OF DEMOGRAPHIC DATA FOR INDIA
Q69: What is omitted in the basic family
Q70: BAR GRAPH OF DEMOGRAPHIC DATA FOR CANADA,