Multiple Choice
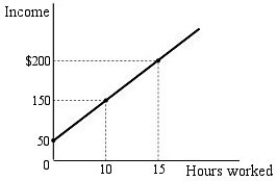
Figure 1.1
-Refer to Figure 1.1.The relationship between hours worked and income,as shown by the graph in Figure 1.1 is
A) negative.
B) positive.
C) nonlinear.
D) exponential.
Correct Answer:

Verified
Correct Answer:
Verified
Related Questions
Q61: Economists will always reach the same conclusion
Q62: Money is an example of a scarce
Q63: If one variable falls as the other
Q64: A key assumption of most economic analysis
Q65: An arrangement that allows buyers and sellers
Q67: Studies that look into the effects of
Q68: Most modern economic analysis is positive in
Q69: When economists construct economic models,<br>A) all but
Q70: Economics tells us what to choose given
Q71: What is an economic view of traffic