Multiple Choice

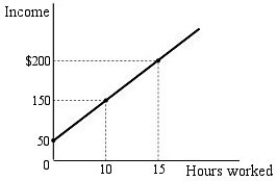
Figure 1.1
-Refer to Figure 1.1.The slope of the relationship,or the wage rate,shown in Figure 1.1 is
A) $5.15 per hour.
B) $10.00 per hour.
C) $13.33 per hour.
D) $15.00 per hour.
Correct Answer:

Verified
Correct Answer:
Verified
Related Questions
Q147: A straight line graph shows<br>A) one variable.<br>B)
Q148: <img src="https://d2lvgg3v3hfg70.cloudfront.net/TB5233/.jpg" alt=" Figure 1.1
Q149: The economic view of traffic congestion considers
Q150: When Bob,a recent college grad,took an internship
Q151: We can use microeconomic analysis to<br>A) learn
Q153: _ is a simplified representation of an
Q154: When we study the effect of how
Q155: Imagine that an upward-sloping line is depicted
Q156: Which of the following is NOT a
Q157: Which of the following is NOT a