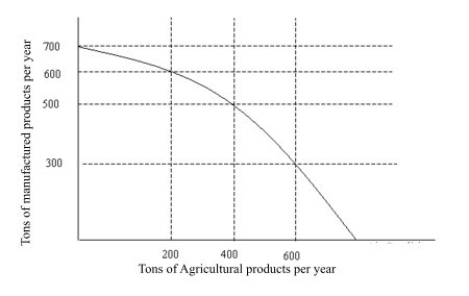
menu-iconExamlexExamLexServices

Discover

Ask a Question
  1. All Topics
  2. Topic
    Business
  3. Study Set
    Microeconomics Principles Applications
  4. Exam
    Exam 2: The Key Principles of Economics
  5. Question
    Figure 2.1 -The Production Possibilities Curve in Figure 2.1 Illustrates the Notion
Solved

Figure 2.1 -The Production Possibilities Curve in Figure 2.1 Illustrates the Notion

Question 56

Question 56

Multiple Choice

   Figure 2.1 -The production possibilities curve in Figure 2.1 illustrates the notion of A)  increased manufactured goods production. B)  increased agricultural production. C)  diminishing resources. D)  opportunity cost.
Figure 2.1
-The production possibilities curve in Figure 2.1 illustrates the notion of


A) increased manufactured goods production.
B) increased agricultural production.
C) diminishing resources.
D) opportunity cost.

Correct Answer:

verifed

Verified

Unlock this answer now
Get Access to more Verified Answers free of charge

Related Questions

Q51: What does an increase in prices in

Q52: What matters to people is the face

Q53: <img src="https://d2lvgg3v3hfg70.cloudfront.net/TB5233/.jpg" alt=" Table 2.4

Q54: <img src="https://d2lvgg3v3hfg70.cloudfront.net/TB5233/.jpg" alt=" Figure 2.1

Q55: <img src="https://d2lvgg3v3hfg70.cloudfront.net/TB5233/.jpg" alt=" Figure 2.3

Q57: When you voluntarily accept a job and

Q58: The economic reason why some individuals choose

Q59: Firms expect to make money on repeat

Q60: The notion of opportunity cost allows the

Q61: <img src="https://d2lvgg3v3hfg70.cloudfront.net/TB5233/.jpg" alt=" Table 2.3

Examlex

ExamLex

About UsContact UsPerks CenterHomeschoolingTest Prep

Work With Us

Campus RepresentativeInfluencers

Links

FaqPricingChrome Extension

Download The App

Get App StoreGet Google Play

Policies

Privacy PolicyTerms of ServiceHonor CodeCommunity Guidelines

Scan To Download

qr-code

Copyright © (2025) ExamLex LLC.

Privacy PolicyTerms Of ServiceHonor CodeCommunity Guidelines