Multiple Choice
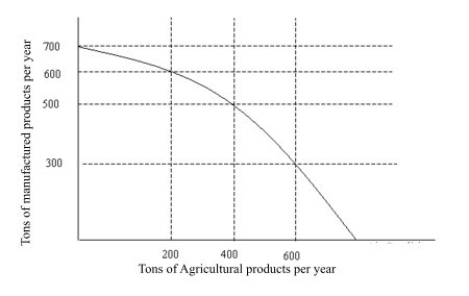
Figure 2.1
-On the production possibilities curve in Figure 2.1,as agricultural production increases by 200 tons per year from 200 tons to 400 tons and then to 600 tons,the opportunity cost in terms of tons of manufactured goods
A) rises.
B) falls.
C) is constant.
D) becomes negative.
Correct Answer:

Verified
Correct Answer:
Verified
Q172: If the price level falls faster than
Q173: <img src="https://d2lvgg3v3hfg70.cloudfront.net/TB5233/.jpg" alt=" Figure 2.2
Q174: Suppose it costs a firm $200 million
Q175: Suppose your bank pays you 6% interest
Q176: The only way individuals can cope with
Q178: <img src="https://d2lvgg3v3hfg70.cloudfront.net/TB5233/.jpg" alt=" Figure 2.1
Q179: Opportunity cost is the difference between the
Q180: <img src="https://d2lvgg3v3hfg70.cloudfront.net/TB5233/.jpg" alt=" Table 2.4
Q181: The real-nominal principle states that<br>A) people respond
Q182: The opportunity cost of something is what