Multiple Choice
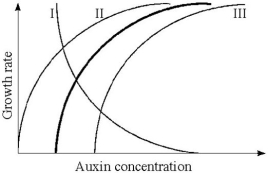
-The heavy line in the above figure illustrates the relationship between auxin concentration and cell growth in stem tissues. If the same range of concentrations were applied to lateral buds, what curve(s) would probably be produced?
A) I
B) II
C) III
D) II or III
E) I or III
Correct Answer:

Verified
Correct Answer:
Verified
Q8: If a long-day plant has a critical
Q9: Which plant hormones would likely be found
Q15: If you wanted to genetically engineer a
Q17: Plant hormones produce their effects by<br>A) altering
Q20: Which of the following is a major
Q21: Plants are affected by an array of
Q24: The biological clock controlling circadian rhythms must
Q55: Why do coleoptiles grow toward light?<br>A) Auxin
Q58: A plant seedling bends toward sunlight because<br>A)
Q108: According to modern ideas about phototropism in