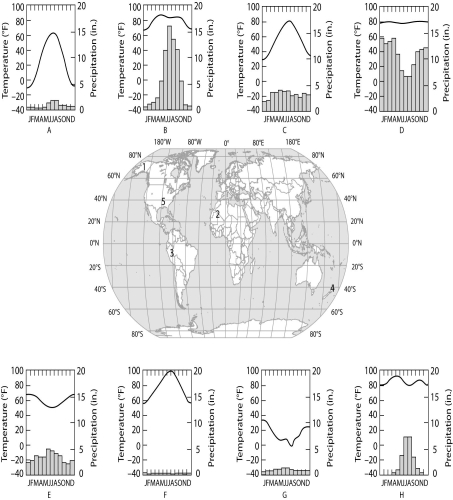
Multiple Choice
The eight climographs below show yearly temperature (line graph and left vertical axis) and precipitation (bar graph and right vertical axis) averages for each month for some locations on Earth. Choose the climograph that best answers the question or completes the statement. Climographs may be used once, more than once, or not at all.

-Which climograph shows the climate for location 2?
A) B
B) C
C) D
D) F
E) H
Correct Answer:

Verified
Correct Answer:
Verified
Q49: Use the following diagram from the text
Q50: The success with which plants extend their
Q51: Trees are not usually found in the
Q52: Fire suppression by humans<br>A) will always result
Q53: Generalized global air circulation and precipitation patterns
Q55: Which of the following abiotic factors has
Q56: Which of the following levels of ecological
Q57: Studying species transplants is a way that
Q58: Which of the following statements best describes
Q59: "How do seed-eating animals affect the distribution