Multiple Choice
Refer to Figure 53.4 and then answer the following questions.
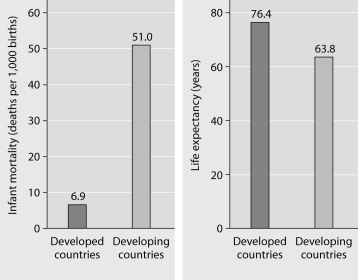
Figure 53.4: Infant mortality and life expectancy at birth in developed and developing countries (data as of 2005) .
-What is a logical conclusion that can be drawn from the graphs above?
A) Developed countries have lower infant mortality rates and lower life expectancy than developing countries.
B) Developed countries have higher infant mortality rates and lower life expectancy than developing countries.
C) Developed countries have lower infant mortality rates and higher life expectancy than developing countries.
D) Developed countries have higher infant mortality rates and higher life expectancy than developing countries.
E) Developed countries have a life expectancy that is about 42 years more than life expectancy in developing countries.
Correct Answer:

Verified
Correct Answer:
Verified
Q49: Which of the following causes populations to
Q50: The following questions refer to Figure 53.3,
Q51: An ecologist recorded 12 white-tailed deer, Odocoileus
Q52: Which statement is true with regard to
Q53: Population ecologists follow the fate of same-age
Q55: Exponential growth of a population is represented
Q56: Which of the following examples would most
Q57: Which of the following statements about the
Q58: Long-term studies of Belding's ground squirrels show
Q59: As N approaches K for a certain