Multiple Choice
Flood recurrence and probability graphs like the one shown below rely on historic records.The predictions for severe floods on graphs like this one are supported by few data points because data for such graphs have generally not been collected longer than a century.What effect would urbanization have on the reliability of using this kind of graph to calculate the frequency and severity of major floods? 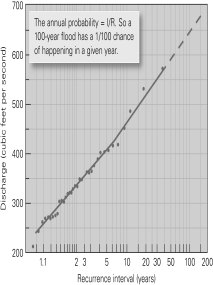
A) an underestimation of severe flood hazard
B) an overestimation of severe flood hazard
C) Urbanization would probably not affect the reliability of estimating severe flood hazard using this graphic predictive technique.
Correct Answer:

Verified
Correct Answer:
Verified
Q4: With time,a river may erode terrain to
Q12: If a 50-year flood occurs on the
Q17: The shape of a delta is primarily
Q24: Look at river Deltas A and B
Q24: All else being equal,water will flow faster
Q25: Braided streams _.<br>A) consist of a series
Q26: The distinction between a valley and a
Q31: Which sediment load carries electrically charged ions?<br>A)
Q32: All flooding events occur so rapidly that
Q41: All flowing water on the continents' surfaces