Multiple Choice
Use the figure below to answer the following question(s) .
Figure 10-9
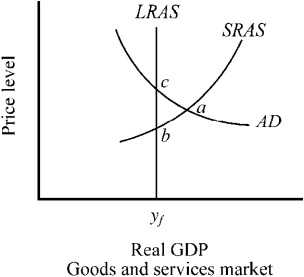
-Currently, the economy depicted in Figure 10-9 is in
A) long-run equilibrium at point b
B) short-run equilibrium at point b
C) long-run equilibrium at point a.
D) short-run equilibrium at point a.
Correct Answer:

Verified
Correct Answer:
Verified
Q1: What impact did the soaring oil prices
Q30: Suppose the economy is initially in long-run
Q71: Which of the following adjustments will most
Q87: If an improvement in the quality of
Q120: Which of the following shifts both short-run
Q157: Figure 10-18<br> <img src="https://d2lvgg3v3hfg70.cloudfront.net/TB3951/.jpg" alt="Figure 10-18
Q175: Since the end of World War II,
Q183: An increase in the consumer sentiment index
Q189: The stability of consumption over the business
Q192: Which of the following would cause prices