Multiple Choice
Figure 10-18
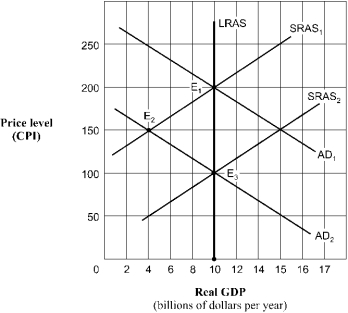
-Given the shift of the aggregate demand curve from AD₁ to AD₂ in Figure 10-18,the real GDP and price level (CPI) in long-run equilibrium will be
A) $10 billion and 200.
B) $4 billion and 150.
C) $10 billion and 150.
D) $10 billion and 100.
Correct Answer:

Verified
Correct Answer:
Verified
Q5: Which of the following is most likely
Q70: Which one of the following factors will
Q73: Within the framework of the AD/AS model,
Q89: Within the AD/AS model, which one of
Q93: Which of the following contributed to the
Q107: Which of the following will most likely
Q108: Under which of the following conditions will
Q112: Figure 10-18<br> <img src="https://d2lvgg3v3hfg70.cloudfront.net/TB3951/.jpg" alt="Figure 10-18
Q119: If a reduction in stock prices reduces
Q184: An economic contraction caused by a shift