Multiple Choice
Figure 15-3
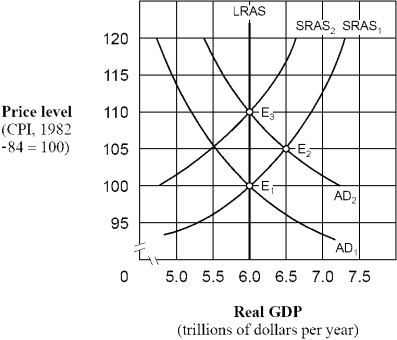
-As shown in Figure 15-3,if people behave according to rational expectations theory,an increase in the aggregate demand curve from AD₁ to AD₂ will cause the price level to move
A) directly from 100 to 105 and then remain at 105.
B) directly from 100 to 110 and then remain at 110.
C) from 100 to 105 initially and then eventually move back to 100.
D) from 100 to 105 initially and then eventually move to 110.
Correct Answer:

Verified
Correct Answer:
Verified
Q2: Assume that during the last several years,
Q53: According to the theory of rational expectations,
Q59: The proponents of adaptive expectations believe that<br>A)
Q72: The modern view of the Phillips curve
Q85: Use the Modern Expectational Phillips curve diagram
Q93: Between 1983 and 2007,the U.S.economy was in
Q94: When there is an abrupt reduction in
Q116: Under the rational expectations hypothesis, which of
Q119: Most economists believe that<br>A) a monetary policy
Q128: Which of the following contributed to the