Multiple Choice
Figure 7-17
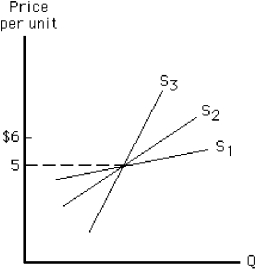
-Consider Figure 7-17. Between the prices of $5 and $6, which supply curve is most elastic and which is least elastic?
A) S₁ is most elastic; S₂ is least elastic.
B) S₁ is most elastic; S3 is least elastic.
C) S3 is most elastic; S₁ is least elastic.
D) S3 is most elastic; S₂ is least elastic.
E) S₂ is most elastic; S3 is least elastic.
Correct Answer:

Verified
Correct Answer:
Verified
Q56: If Francis experiences a decrease in his
Q90: If a Pizza Hut restaurant near campus
Q116: If the price of steak rises from
Q130: Consider a consumer who purchases two goods,
Q133: If an increase in the excise tax
Q135: "I like ice cream, but after eating
Q148: The fact that a gallon of gasoline
Q158: If you compared the short-run demand and
Q160: A good with a high income elasticity
Q175: Figure 7-16 <img src="https://d2lvgg3v3hfg70.cloudfront.net/TB7348/.jpg" alt="Figure 7-16