Multiple Choice
Use the figure below to answer the following question(s) .
Figure 4-9
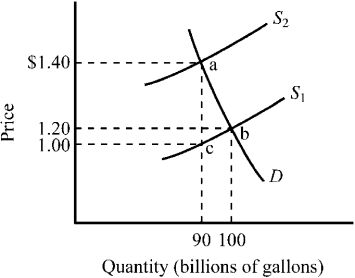
-Refer to Figure 4-9. The market for gasoline was initially in equilibrium at point
A) the supply of gasoline would shift to S2.
B) the price of gasoline to consumers would increase from $1.20 per gallon to $1.40 per gallon.
C) the net price received by producers of gasoline would decline from $1.20 per gallon to $1.00 per gallon.
D) all of the above would occur.
Correct Answer:

Verified
Correct Answer:
Verified
Q8: The Laffer curve illustrates the concept that<br>A)
Q48: Kathy works full time during the day
Q62: Use the figure below to answer the
Q90: Data from the effects of the substantial
Q118: A price floor set above an equilibrium
Q135: Use the figure below to answer the
Q135: Use the figure below illustrating the impact
Q151: If an increase in the government-imposed minimum
Q200: If the federal government began granting a
Q254: Taxes create deadweight losses because they<br>A) reduce