Short Answer
Use the Figure above to answer the following question(s).
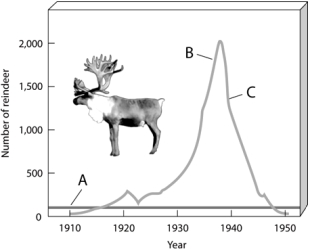
-Choose the portion of the graph that can be called a dieback.
Correct Answer:

Verified
Correct Answer:
Verified
Related Questions
Q37: Humans are exempt from population overshoot and
Q80: In predator-prey relationships,the predator is seeking food
Q86: A population's growth rate will increase as
Q87: Systems, such as the global climate, can
Q88: Explain coevolution using the interaction between the
Q90: One of the factors determining at what
Q92: Which of the following is not a
Q94: _ is a competitive interaction between species
Q95: The most common interaction between species is
Q96: A plot of the number of individuals