Short Answer
Use the Figure above to answer the following question(s).
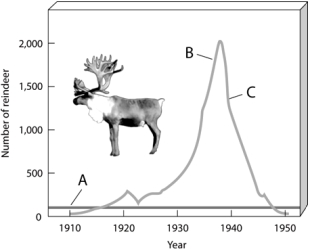
-Choose the portion of the graph that represents the number of reindeer that exceeded the capacity of their environment.
Correct Answer:

Verified
Correct Answer:
Verified
Related Questions
Q10: In _,two species behave in ways that
Q35: Succession leads inevitably toward an ideally adapted
Q36: <img src="https://d2lvgg3v3hfg70.cloudfront.net/TB5015/.jpg" alt=" -Observe the Figure
Q38: If the resilience of a damaged area
Q41: Which of the following is said to
Q43: Considering the different types of interactions mentioned
Q52: Which of the following exhibits secondary ecological
Q54: Parasites _.<br>A) rarely kill their hosts<br>B) are
Q68: Scientists have changed their view about a
Q77: _ involves the gradual establishment of biotic