Multiple Choice
The graph of immigration over time to the United States shows 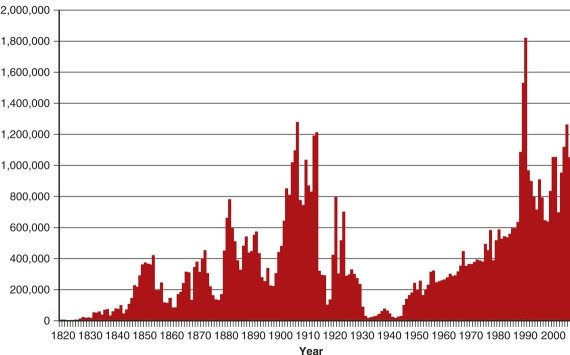
A) almost as much immigration in 2010 as 1910.
B) much immigration in the early 1900s when the U.S.did not restrict entry.
C) low points in immigration during the depression and World War II.
D) all of the above.
Correct Answer:

Verified
Correct Answer:
Verified
Q1: Migration to the United States today can
Q2: An area of slave trade that most
Q4: The best example of a 'center of
Q5: Which is the best example of rural
Q6: The factor mobility model is most dependent
Q7: The gravity model generally demonstrates that<br>A)two cities
Q8: In 2010 Arizona became a center of<br>A)a
Q9: Which is the best example of internal
Q10: Refugee warehousing involves<br>A)large metal buildings filled with
Q11: Which of the following examples best exhibits