Multiple Choice
In analyzing the graph showing the changing density patterns for Cleveland, in 1950 the highest population densities occurred ______________ miles from the CBD while in 1990 they peaked at _________________. 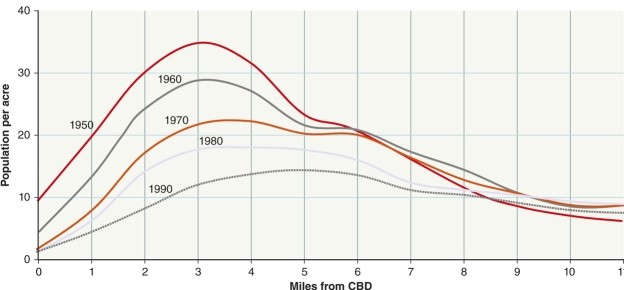
A) .5;2
B) 3;5
C) 4;8
D) 6;12
Correct Answer:

Verified
Correct Answer:
Verified
Related Questions
Q5: Traditionally, land values in the CBD were
Q6: Squatter settlements are most likely to be
Q7: At the urban center of a modern
Q8: Generally, skyscrapers are not built toward the
Q9: In terms of density which would be
Q11: Abraham Levitt was<br>A)a Jew who almost became
Q12: The center of the traditional walking city,
Q13: At the center of the city population
Q14: Generally in the U.S.cities become less compact
Q15: Planned parkland developments around European cities like