Multiple Choice
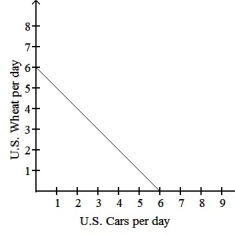
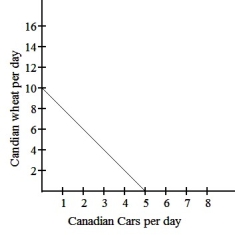
The graphs above show the production possibilities curves for the U.S.and Canada,which both produce cars and wheat.
Based on the graphs above,which of the following is true?
A) The U.S. has an absolute advantage in both goods.
B) Canada has an absolute advantage in cars.
C) The U.S. has a comparative advantage in cars.
D) The U.S. has a comparative advantage in wheat.
Correct Answer:

Verified
Correct Answer:
Verified
Q14: Assume that both the United States and
Q15: Competition between the United States and Mexico
Q16: Which of the following is true?<br>A)Adam Smith
Q17: Given that Sandy can produce 10 economics
Q19: <img src="https://d2lvgg3v3hfg70.cloudfront.net/TB3033/.jpg" alt=" The
Q20: Suppose that Canada can produce 15 timber
Q21: A country possesses a comparative advantage in
Q22: Suppose that Canada can produce 15 units
Q23: Comparative advantage can change over time.
Q33: What is productivity?