Multiple Choice
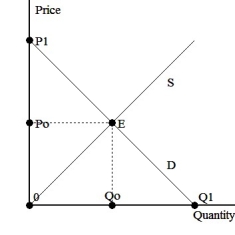
The graph above shows supply and demand in the domestic market without trade.Producer surplus without trade is represented by area
A) P1-E-Po
B) P1-E-0
C) Po-E-0
D) P1-E-Qo
Correct Answer:

Verified
Correct Answer:
Verified
Related Questions
Q22: Use a graph to demonstrate why quotas
Q23: <img src="https://d2lvgg3v3hfg70.cloudfront.net/TB3033/.jpg" alt=" The graph
Q24: In which way are tariffs different from
Q25: The rules for respecting property rights as
Q26: What is Joseph Stiglitz's main criticism regarding
Q28: Based on Figure 6.1,how much revenue will
Q29: A real cost of tariffs and quotas
Q30: What are some of the long-run costs
Q31: <img src="https://d2lvgg3v3hfg70.cloudfront.net/TB3033/.jpg" alt=" The graph above
Q32: Intellectual property rights protection is a critical