Multiple Choice
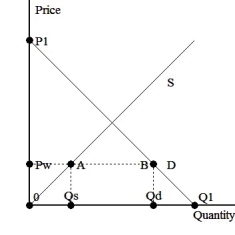
The graph above shows domestic supply and demand with trade.With trade,this country can purchase at the world price,Pw.
Which of the following areas represents consumer surplus with trade?
A) Pw-A-0
B) Pw-B-Qd-0
C) P1-B-Pw
D) P1-B-A-0
Correct Answer:

Verified
Correct Answer:
Verified
Q41: High tariffs on intermediate inputs<br>A)increase the effective
Q42: The production side efficiency loss of a
Q43: In the case of a small country,consumer
Q44: <img src="https://d2lvgg3v3hfg70.cloudfront.net/TB3033/.jpg" alt=" The graph above
Q45: Consumer surplus is equal to the area<br>A)under
Q47: <img src="https://d2lvgg3v3hfg70.cloudfront.net/TB3033/.jpg" alt=" The graph above
Q48: Which of the following would be a
Q49: Developing countries have identified which key issues
Q50: Efficiency losses are<br>A)deadweight losses caused by consumers
Q51: Internationally,the TRIPS agreement is uniformly regarded as