Multiple Choice
In Figure 3.2, the solid line depicts normal hemoglobin. 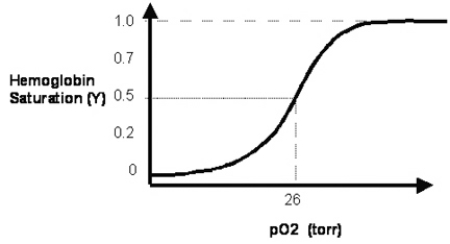 How does the normal curve change when the 2,3-bisphosphoglycerate (2,3-BPG) concentration is reduced?
A) The oxygen half-saturation pressure value P50 of the new hemoglobin saturation curve is reduced.
B) The maximal saturation of hemoglobin with oxygen is reduced to less than a value of 1.0.
C) The oxygen partial pressure (pO₂) at which hemoglobin attains a Y-axis value of 0.25 is increased.
D) The new curve has a Y-axis value of 0.25 at a pO₂ of 26 mm Hg.
E) The new curve has a reduced slope at the P50 value of 26 mm Hg.
Correct Answer:

Verified
Correct Answer:
Verified
Q1: The quaternary structure of deoxyhemoglobin is maintained,
Q2: A solution of equal amounts of hemoglobin
Q3: The effect of high 2,3-BPG in red
Q4: An experienced hiker, H.A., spends her vacation
Q5: Which of the following statements about hemoglobin
Q6: Most of the carbon dioxide that is
Q8: The oxygen dissociation curve of hemoglobin is
Q9: Fetal hemoglobin has a somewhat higher oxygen-binding
Q10: A 26-year-old scuba diver returns after a