Multiple Choice
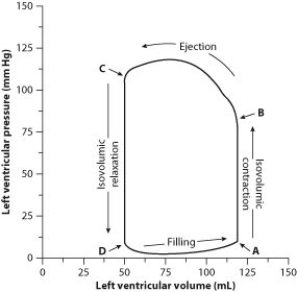
To evaluate cardiac function, scientists and physicians measure both the pressure and the volume inside the heart. When both pressure and volume data are plotted on the same graph, the resulting graph is called a pressure-volume loop. To create a pressure-volume loop, a catheter (a thin tube) is inserted into the vessels of the heart, and measurements of both left ventricular pressure and left ventricular volume are taken. The data are plotted on a graph, and cardiac function can then be evaluated from the distribution of the data and the shape of the loop.
The following figure shows a typical left ventricle pressure-volume loop for a healthy young adult. The cardiac cycle proceeds counterclockwise. Each complete turn around the loop (for example, starting at point A and ending back at point A) represents one complete cardiac cycle.
-How much blood is ejected from the left ventricle during one contraction?
A) 35 mL
B) 65 mL
C) 70 mL
D) 135 mL
Correct Answer:

Verified
Correct Answer:
Verified
Q26: As blood moves away from the heart
Q27: Stem cells found in the red marrow
Q28: Which of the following animals has a
Q29: Which of the following statements regarding circulatory
Q30: To evaluate cardiac function, scientists and physicians
Q32: Whether there is a net flow of
Q33: Although birds and mammals descended from different
Q34: Cardiac output is defined as the volume
Q35: Adaptation to terrestrial life involved major evolutionary
Q36: Oxygen-poor blood is carried from the heart