Multiple Choice
To evaluate cardiac function, scientists and physicians measure both the pressure and the volume inside the heart. When both pressure and volume data are plotted on the same graph, the resulting graph is called a pressure-volume loop. To create a pressure-volume loop, a catheter (a thin tube) is inserted into the vessels of the heart, and measurements of both left ventricular pressure and left ventricular volume are taken. The data are plotted on a graph, and cardiac function can then be evaluated from the distribution of the data and the shape of the loop.
The following figure shows a typical left ventricle pressure-volume loop for a healthy young adult. The cardiac cycle proceeds counterclockwise. Each complete turn around the loop (for example, starting at point A and ending back at point A) represents one complete cardiac cycle.
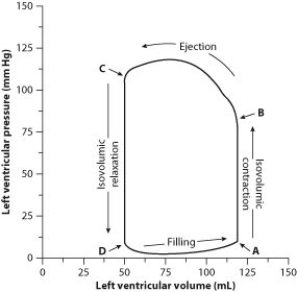
-Aortic stenosis is a disease in which the aortic valve (the semilunar valve between the left ventricle and the aorta) narrows, resulting in increased left ventricular pressure and reduced ejection volume (the amount of blood that the left ventricle ejects) . What would the pressure-volume graph for a patient with aortic stenosis look like compared to the graph shown above for a healthy young adult?
A) taller and wider
B) taller and narrower
C) shorter and narrower
D) shorter and wide
Correct Answer:

Verified
Correct Answer:
Verified
Q59: What is the most common cause of
Q60: During ventricular systole, the semilunar valves _
Q61: Which of the following statements regarding blood
Q62: You are dissecting a "mystery animal" in
Q63: Ron and Tiffany are studying circulatory
Q65: Which of the following is a function
Q66: Ron and Tiffany are studying circulatory
Q67: At any given time, what percentage of
Q68: During which phase of the heartbeat do
Q69: Electrocardiographs (ECGs or EKGs) provide data about