Multiple Choice
According to this graph of population growth in Mexico, in what year was the rate of population increase in Mexico the greatest? 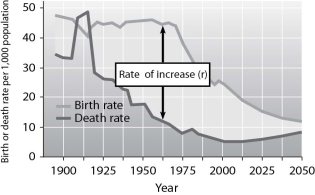
A) 1912
B) 1930
C) 1965
D) 2000
Correct Answer:

Verified
Correct Answer:
Verified
Related Questions
Q15: A Type I survivorship curve is associated
Q18: An ecological footprint<br>A) is a means of
Q29: The maximum number of individuals a habitat
Q29: An r-selected species typically<br>A)offers considerable parental care
Q30: In terms of population dynamics, what is
Q35: Which of the following statements regarding logistic
Q36: You drive through Iowa in the spring
Q37: Which of the following will likely decrease
Q38: Which of the following is a practical
Q39: Guppies from Trinidad form two distinct populations