Short Answer

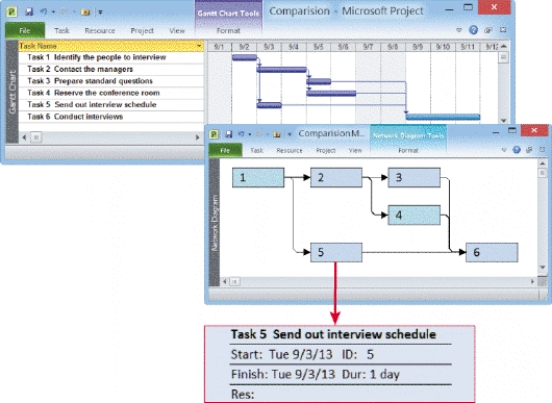
-The PERT chart called a network diagram in the accompanying figure represents a bottom-up technique, because it analyzes a large, complex project as a series of individual ____________________.
Correct Answer:

Verified
Correct Answer:
Verified
Related Questions
Q28: When tasks must be completed one after
Q43: MATCHING<br>Identify the letter of the choice that
Q44: MATCHING<br>Identify the letter of the choice that
Q46: Critical time is the amount of time
Q47: Structured walk-throughs take place throughout the SDLC
Q49: A _ might involve maximums for one
Q50: For a project manager, reporting _.<br>A)involves controlling
Q51: MATCHING<br>Identify the letter of the choice that
Q52: _ is a possible cause of cost
Q53: When two or more concurrent tasks depend