Multiple Choice
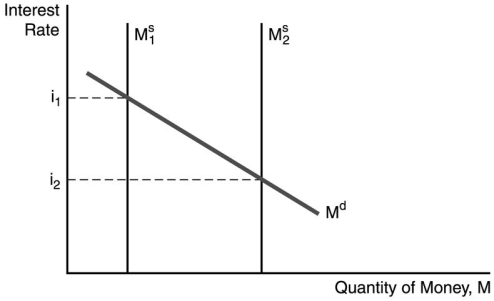
-In the figure above, the decrease in the interest rate from i₁ to i₂ can be explained by ________.
A) a decrease in money growth
B) an increase in money growth
C) a decline in the expected price level
D) an increase in income
Correct Answer:

Verified
Correct Answer:
Verified
Q19: In Keynes's liquidity preference framework<br>A)the demand for
Q19: <img src="https://d2lvgg3v3hfg70.cloudfront.net/TB5039/.jpg" alt=" -The figure above
Q23: The riskiness of an asset is measured
Q36: Demonstrate graphically the effect of an increase
Q38: Both the CAPM and APT suggest that
Q53: When the price of a bond decreases,all
Q61: Everything else held constant,when households save less,wealth
Q92: When the inflation rate is expected to
Q145: <img src="https://d2lvgg3v3hfg70.cloudfront.net/TB2988/.jpg" alt=" -In the figure
Q157: A rise in the price level causes